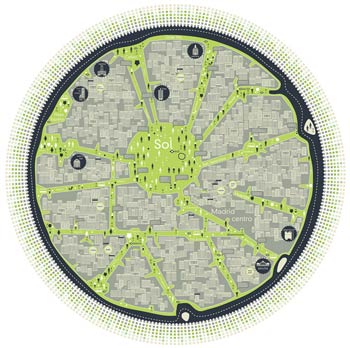
Isotype data viz
Gerd Arntz designed around 4000 signs, which symbolized key data from industry, demographics, politics and economy, for the visual language Isotype.
The International System Of TYpographic Picture Education was developed by the Viennese social scientist and philosopher Otto Neurath (1882-1945) as a method for visual statistics. Gerd Arntz (1900-1988) was the designer tasked with making Isotype’s pictograms and visual signs.
Can you imagine the task???


_______
He also was one of the first doing graphics that are referred to as data vizualisation or information graphics today. Check the Statistics section to see examples. Now that’s being ahead of your times. Pretty impressive isn’t it?


