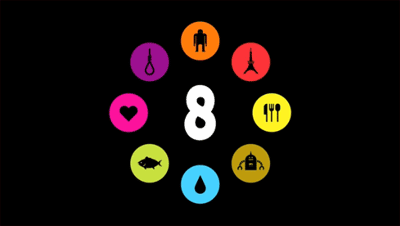
Planes or Volcano?
Planes or Volcano? What’s emitting the most CO2 per day? Data visualization illustration by Information is Beautiful.


Planes or Volcano? What’s emitting the most CO2 per day? Data visualization illustration by Information is Beautiful.
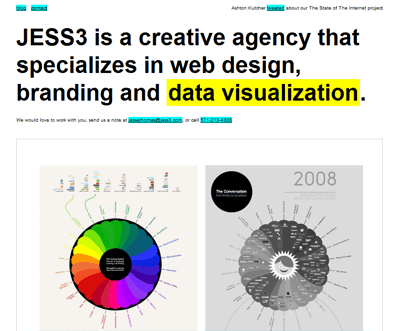
JESS3 (founded by Jesse Thomas) is a creative agency that specializes in web design, branding and data visualization. They are behind producing very popular projects, such as the State of the Internet (which we featured recently), Mashable iPhone app and Unsung Designers.
What kind of brain does it take to be able such complexity?
Proof enough that information design and data visualization compressed into simple animatics can cross language barrier.
Japan – The Strange Country (Japanese ver.) by Kenichi


_______
via: Fubiz
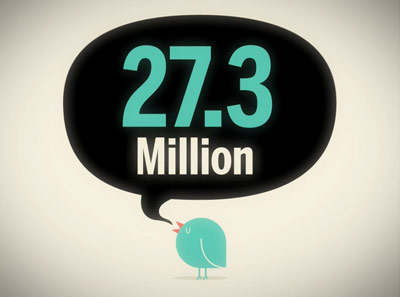
The State of the Internet was designed and animated by Jesse Thomas, for his lecture at AIGA Baltimore in Feb 2010. He is the CEO and founder of JESS3 a creative interactive agency specializing in social media data visualization.
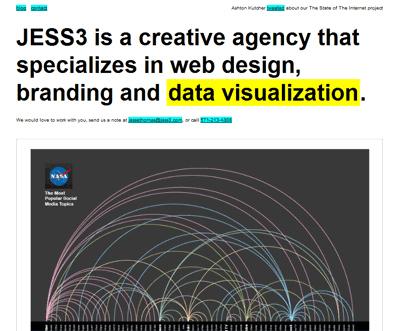
Striking numbers, such as 234M websites, 27.3M tweets per day and 84% social networks with more women than men. Ha!

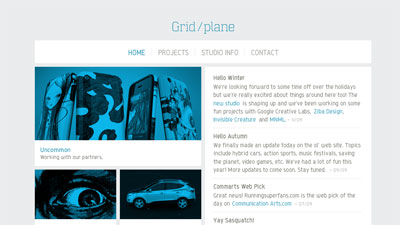
JD Hooge (x Second Story) founded Gridplane 10 yrs ago, to help big and small clients bring their stories to life. Gridplane specializes in unifying practical user interaction with engaging design to craft unique experiences. As you can see, the website is all about sobriety, light gray background and blue / black thumbnails, links, etc.
He is well-know for his extraordinary dataviz projects. No slowing down in sight for this interactive veteran.


Gerd Arntz designed around 4000 signs, which symbolized key data from industry, demographics, politics and economy, for the visual language Isotype.
The International System Of TYpographic Picture Education was developed by the Viennese social scientist and philosopher Otto Neurath (1882-1945) as a method for visual statistics. Gerd Arntz (1900-1988) was the designer tasked with making Isotype’s pictograms and visual signs.
Can you imagine the task???


_______
He also was one of the first doing graphics that are referred to as data vizualisation or information graphics today. Check the Statistics section to see examples. Now that’s being ahead of your times. Pretty impressive isn’t it?

Up-close with a complex data visualisation poster for A B Peace and Terror project created by The Luxury of Protest.


Search for inspiration and/or talent in Netdiver Mag.
pinterest / medium / linkedin / X / rss

Our little studio owned Adobe Master Suites—invoking security issues our perpetual licenses were nulled. Undone? No!
I can open all .pdf, .psd or .ai files in the Affinity apps and the UI/UX is so gorgeous!
See for yourself: test the Affinity suite. Works on all platforms + iPad for—6 MONTHS FREE!
_______

Connected to the internet's origins, building the internet of the future. We’re building ways to help everyone fight for privacy online. I am a big fan of their services.
_______

What a strange name for an independent Internet privacy company. Contrary to G/ who records every instance of their services useage with DDG, no recording of your data, EVER!!!
We use it everyday.
_______

This private (free) app I use daily for taking notes or writing. Back up to the cloud for multi-devices access. Runs locally.
_______

I paint abstract with pretty colours ~ I play with mobile apps to create unique generative art.
Look 'Ma no AI.
_______

Communication Arts 24-25—calls for entries.
Interactive — October 25/24
Illustration — Jan 10/25
Photography — March 7/25
Design — May 2/25
_______

The Smashing Conferences explore real-life projects, workflows and hands-on insights.
SmashingConf - Antwerp
Upcoming: Oct 28-31/24
SmashingConf - Workshops
Online: check dates.
_______

AIGA’s competitions celebrate exemplary design and demonstrate the power of effective design.
50 Books | 50 Covers: February 26 / 24
365: AIGA Year in Design February 26 / 24

It is a conference and a community of thousands of women influencers and entrepreneurs in creative fields.
Upcoming: March 17-20 / 24
_______

YouWorkForThem — Good design needs good fonts! YWFT is privately owned and run by designers.
Rocking it since 2001.
Mind-blowing visual feats and original designs I recently discovered.
Previously: #12 - #11 - #10 - #9 - #8 - #7 - #6 - #5 - #4 - #3 - #2 - #1

_______
Illustration is probably the largest creative area to express (mostly without words) a message.

_______
A type of Show #5 – I love typography - these projects caught my eye.

_______
Moodboards #1 – Branding collaterals staged and served with conceptual brilliance.

A little (www) Story. In 1995, JF and I started a little project — Netdiver mag.

_______

Editorials. Design topics or issues that have impacted me and/or our creative industry. .
Over 50 articles.
_______

A short interview on how to build a strong portfolio + self-promotion.
Carole Guevin is a founder + editor + design curator ∞ culture creator + online pioneer ∞ featuring the creative culture since '98.
_______
No hype — just beautiful
_______

Netdiver long-standing mini visuals (200 x 115 px) galleries. Each lead to its review. Happy talent discovery!
_______

Vast array of drawing styles
404 reviews
_______

Conceptual designs standing out
358 reviews
_______

Products / packaging design / spaces +
333 reviews
_______

Brilliant storyboards / motion / vfx
286 reviews
_______

Some of the sharpest eyes shooting today
210 reviews
_______

New wave of design / interactive / mobile stars
552 reviews
_______

Women who rock the design scene with _more_ than pink design
391 reviews

Visual Brain Gravity is a producer and developer of concepts, products and brand experiences.
Driven by vision.
_______

Self-curation experiment coupled with minimalist interviews with people in the design industry I admire.
By invitation only
_______

Terrific product or service or event and wanna reach a fabulous international audience?
Advertise with us
Coming soon
_______

Netdiver Best of the Year is a yearly compilation of projects / talents who made a lasting impression the previous year.
_______

What was new in design worldwide—sort of a very unofficial record of web history as captured from {1998 - 2007}.
Over 2.3k+ projects.
_______
Walk down memory lane: hand-coded news in design from 1998-2008.
_______
Terrific product or service or event and wanna reach a fabulous international audience?
Advertise with us
Dates soon.
_______
Check what inspires me? Follow my Pinterest.